Profiling with Legion
Building FleCSI with the Legion backend adds an additional set of tools for profiling your application. See Legion’s Performance Profiling and Tuning page for a detailed list of tools and their available options.
The following describes how to use Legion Prof to generate a simple profile:
Here we create a profile of the flecsi/run/cycle test. We use the
--backend-args option to pass command-line options to the Legion backend. In
this case, the option to enable profiling for 1 processor and how to call the
profiling log file(s).
$ ./flecsi/run/cycle --backend-args="-lg:prof 1 -lg:prof_logfile prof_%.gz"
After the application completes, the generated profiling log files need to be
passed on to legion_prof.py:
$ legion_prof.py prof_*.gz
Reading log file prof_0.gz...
parsing prof_0.gz
Matched 826 objects
Generating interactive visualization files in directory legion_prof
emitting utilization
elapsed: 0.11297273635864258s
This produces a new folder called legion_prof containing a visualization.
These files need to be hosted by a local webserver to be viewed. One of the
simplest ways of achieving this is by using Python’s embeded HTTP server:
$ cd legion_prof
$ python3 -m http.server
This will host the Legion Prof GUI on your local system at http://localhost:8000.
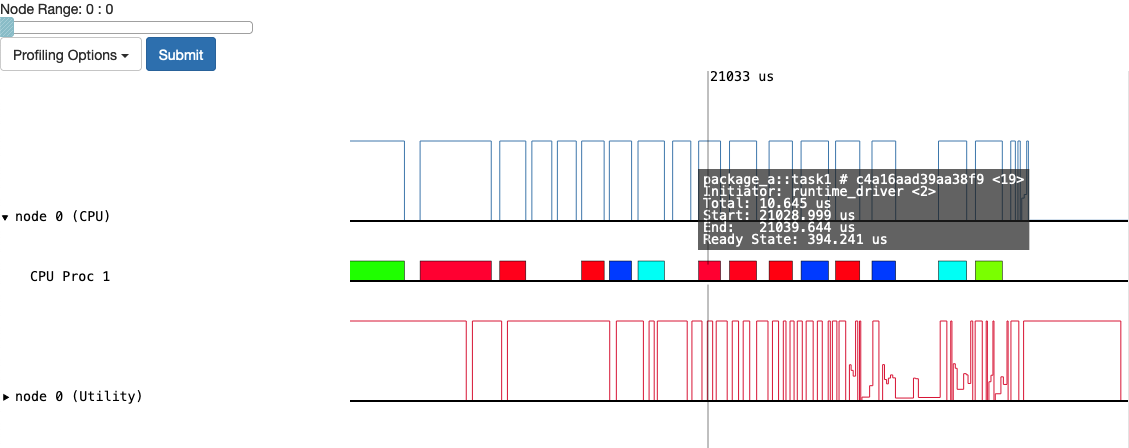
Fig. 24 Screenshot of Legion Prof GUI for cycle test
Please see the Performance Profiling and Tuning page for further details on how to use the GUI.
Note
FleCSI shortens the registered task names to function_name # <HASH> when
passing them to Legion. The matching full function signatures can be obtained
from flecsi::task_names(), which returns a mapping of the shortened function
signature to its full signature.